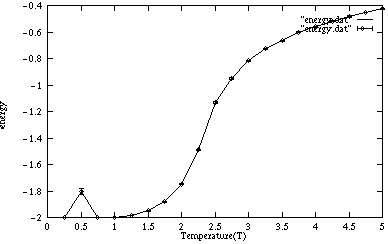
エネルギー
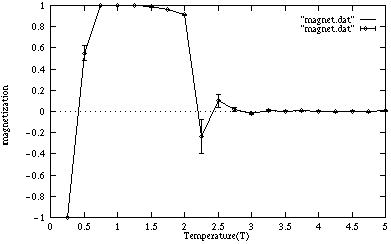
磁化
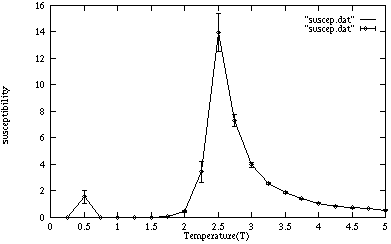
帯磁率
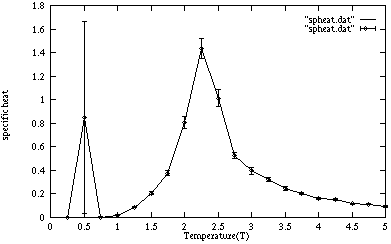
比熱
「計算物理」の教科書でFORTRANで設計されている2次元イジング模型を C++言語で設計してみよう。イジング模型と熱浴法など理論については 旧版を参照のこと。ここでは新しい内容のみを紹介する。
プログラムを設計し始めよう。ソースファイルは ising.cc である。まずは諸定数の定義である。
#include "cip.h"
#include "nxgraph.h"

//---- definition of fundermental constants
//---- physical constants
const double J      = 1.0;           // bonding constant
const double H      = 0.0;           // external magnetic field
const int SIZE      = 16;            // size of lattice

//---- experimental settings
// settings about temperature
const double T_INIT = 0.50;          // initial temperature
const double T_FINA = 5.00;          // final   temperature
const double T_STEP = 0.25;          // increments

// settings about sweep the lattice
const int RELAX     = 400;           // steps till relaxation
const int INTERVAL  = 10;            // steps per one measure

// settings about number of data to measure fluctuations of ...
const int SAMPLES   = 40;            // energy, magnetization
const int GROUPS    = 20;            // susceptibility, specific heat

// file names of output data
const char* fnames[4] = {  "energy.dat", "magnet.dat", "suscep.dat", "spheat.dat" };
// titles of each quantities
const char* titles[4] = {  "Energy", "Magnetization", "Susceptibility", "Specific heat" };
// file pointers
static FILE* fptrs[4];

//---- index indicators
const int ENERGY    = 0;
const int MAGNET    = 1;
const int SUSCEP    = 2;
const int SPHEAT    = 3;

//---- graphics settings
const int    WIN_WIDTH  = 256;
const int    WIN_HEIGHT = 256;
SIZE が格子の一辺のスピンの数である。 プログラムでは各温度に設定後 RELAX 回だけ格子を操引して 平衡状態にする。その後は INTERVAL 回の操引でデータを採取する。 エネルギーと磁化が簡単に求まるが、実験は一回の測定で終る ものではない。SAMPLES 回の測定を重ねてエネルギーと磁化の 平均値と分散を求める。この分散から帯磁率と比熱が求まる。 この4つの量の平均値とエラーを得るため、さらにこの測定作業を GROUPS 回行う。
このプログラムでは統計量のデータ収集が重要である。 データの平均値(mean)、分散(variance)、標準偏差(standard deviation)、 そして平均値の偏差(error)を機能的に計算する機構が必要である。 そこで次のclass Statistic を作成する。
//---- declaration and definition of class Statistic
class Statistic
{
  int n;                // current total of data
  double sum1, sum2;    // current sum of data and its square
public:
  inline Statistic( void ){
    n = 0;    sum1 = sum2 = 0.0;
  }
  //-- adds a new datum
  inline void Add( double datum ){
    n++;    sum1 += datum;    sum2 += datum*datum;
  }
  //-- current mean value
  inline double Mean( void ){
    return( sum1/n );
  }
  //-- current variance value
  inline double Variance( void ){
    return( (sum2 - sqr(sum1)/n)/(n-1) );
  }
  //-- current deviation value
  inline double Deviation( void ){
    return( sqrt( Variance() ) );
  }
  //-- current deviation of mean value, namely error value
  inline double Error( void ){
    return( sqrt( Variance()/n ) );
  }
};
内容は単純である。Constructorに総和の初期化を行わせる。 Add() methodにデータをひとつづつ与えて、統計量が 必要な所でそのmethodを呼び出すだけである。この各種統計量の 定義式を以下にまとめておく。
次にスピン1個の上下動を管理するclass Spin を定義する。
//---- declaration and difinition of class Spin
class Spin
{
  int spin;      // the value of spin, it takes +1 or -1
public:
  //-- sets this spin randomly +1 or -1
  void RandSet( void ){
    if( Urand() > 0.5 ) spin = +1; else spin = -1;
  }
  //-- represents the value of spin when this object is called
  operator int (){
    return( spin );
  }
  //-- transits this spin by given probability
  void Transit( int s_sum, double prob ){
    if( Urand() < prob ) spin = +1; else spin = -1;
  }
};
次に格子を管理するclass Lattice を宣言する。
//---- declaration of class Lattice
class Lattice
{
  Spin spin[SIZE][SIZE];    // spins in this lattice
  double prob[5];           // table of transition probability
public:
       Lattice( double T );
  void Sweep( int interval );
  void Measure( Statistic& Energy, Statistic& Magnet );
  void Draw( void );
private:
  inline void Neighbor( int& im, int& ip, int i );
};
//---- makes transition propability table and let spins randomly turn
Lattice::Lattice( double T )
{
  for( int s_sum=-4 ; s_sum<=+4 ; s_sum+=2 ){
    double eplus = exp( (J*s_sum+H)/T );
    prob[s_sum/2+2] = eplus/(eplus+1.0/eplus);
  }
  for( int ix=0 ; ix<SIZE ; ix++ ){
    for( int iy=0 ; iy<SIZE ; iy++ ){
      spin[ix][iy].RandSet();
    }
  }
}
//---- gets neighbors' indices of given index
inline void Lattice::Neighbor( int& im, int& ip, int i ){
  if( i==0 ) im = SIZE-1; else im = i-1;
  if( i==SIZE-1 ) ip = 0; else ip = i+1;
}

//---- sweeps this lattice [interval] times
void Lattice::Sweep( int interval )
{
  int ix, iy, ixm, ixp, iym, iyp;
  int s_sum;

  while( interval-- ){
    for( ix=0 ; ix<SIZE ; ix++ ){
      Neighbor( ixm, ixp, ix );
      for( iy=0 ; iy<SIZE ; iy++ ){
        Neighbor( iym, iyp, iy );
        s_sum = spin[ixp][iy] + spin[ixm][iy] + spin[ix][iyp] + spin[ix][iym];
        spin[ix][iy].Transit( s_sum, prob[s_sum/2+2] );
      }
    }
  }
}
//---- evaluates energy and magnetization of this lattice
void Lattice::Measure( Statistic& Energy, Statistic& Magnet )
{
  int ix, iy, ixm, ixp, iym, iyp;
  int s_sum=0, ss_sum=0;

  for( ix=0 ; ix<SIZE ; ix++ ){
    Neighbor( ixm, ixp, ix );
    for( iy=0 ; iy<SIZE ; iy++ ){
      Neighbor( iym, iyp, iy );
      s_sum  += spin[ix][iy];
      ss_sum += spin[ix][iy] * (spin[ixm][iy] + spin[ix][iym]);
    }
  }
  const double energy = -J*ss_sum - H*s_sum;
  const double magnet = (double) s_sum;
  Energy.Add( energy );
  Magnet.Add( magnet );
}
//---- draws spins as colored square
void Lattice::Draw( void )
{
  NXClearWindow();

  const int dX = WIN_WIDTH/SIZE, dY = WIN_HEIGHT/SIZE;
  for( int ix=0 ; ix<SIZE ; ix++ ){
    for( int iy=0 ; iy<SIZE ; iy++ ){
      if( spin[ix][iy] == +1 ) NXSetColor( NX_YELLOW ); else NXSetColor( NX_BLUE );
      NXFillRectangle( ix*dX, iy*dY, dX-1, dY-1 );
    }
  }
  NXFlush();
}
//---- opens four files to save data
void OpenFiles( void )
{
  for( int i=0 ; i<4 ; i++ ){
    fptrs[i] = fopen( fnames[i], "wt" );
    if( fptrs[i] == NULL ){
      perror("Error at fopen.");
      exit(1);
    }
  }
}

//---- closes the files
void CloseFiles( void )
{
  for( int i=0 ; i<4 ; i++ ){
    fclose( fptrs[i] );
  }
}

//---- prints and saves each quantities in the four files
void Output( double T, Statistic quantity[] )
{
  printf("\nTemperature    =  %lf\n", T );

  for( int i=0 ; i<4 ; i++ ){
    printf("%-14s = % lf +/- %lf\n", titles[i], quantity[i].Mean(), quantity[i].Error() );
    fprintf( fptrs[i], "%lf  %lf %lf\n", T, quantity[i].Mean(), quantity[i].Error() );
  }
}
//---- executes experiment at given temperature
void Experiment( double T )
{
  Lattice   latt(T);
  Statistic quantity[4];

  latt.Sweep( RELAX );     // makes the lattice equilibrium

  for( int group=0 ; group<GROUPS ; group++ ){
    Statistic Energy0, Magnet0;

    // measures fluctuations of energy and magnetization
    for( int sample=0 ; sample<SAMPLES ; sample++ ){
      latt.Sweep( INTERVAL );
      latt.Measure( Energy0, Magnet0 );
    }
    // calculates other data per spin statistically
    quantity[ENERGY].Add( Energy0.Mean()/(SIZE*SIZE) );
    quantity[MAGNET].Add( Magnet0.Mean()/(SIZE*SIZE) );
    quantity[SUSCEP].Add( Magnet0.Variance()/T/(SIZE*SIZE) );
    quantity[SPHEAT].Add( Energy0.Variance()/sqr(T)/(SIZE*SIZE) );

    latt.Draw();
  }

  Output( T, quantity ); // saves data in files
}
注意すべきはEnergy0, Magnet0 の宣言がループ内にあること である。ループ内で宣言した変数はその回ごとに初期化、解体が行われる ことを思いだそう。つまりプログラムの実行がその宣言文を通るたびに それぞれのconstructorが起動する。このため各回の統計データが 自動的に初期化され独立な実験データとなるのである。
最後にmain() 関数である。
//---- main function
int main(void)
{
  XEvent ev;
  NXOpenWindow( "Ising Model", WIN_WIDTH, WIN_HEIGHT );
  NXEnable( NX_DOUBLEBUFFER );

  OpenFiles();

  for( double T=T_INIT ; T<=T_FINA ; T+=T_STEP ){  // temperature loop
    Experiment( T );
  }

  CloseFiles();
  NXCloseWindow();
  return(0);
}
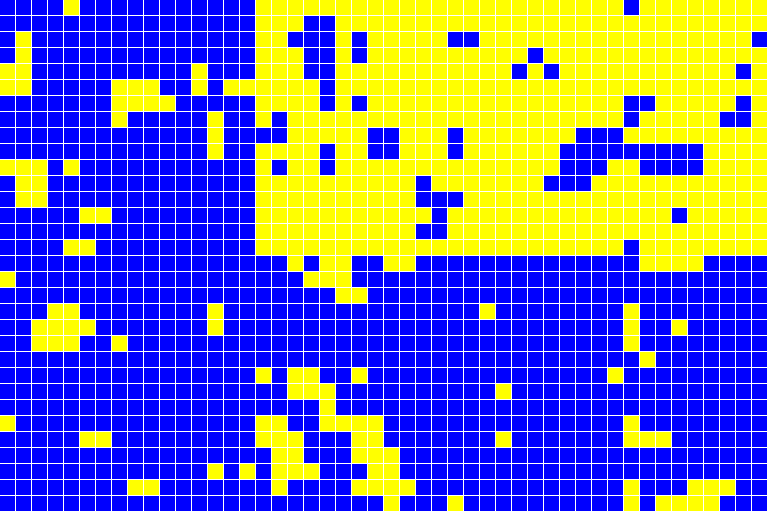
データをgnuplotでグラフにしたものを下に載せる。 いくつかの温度でのスピンの様子のグラフィックも載せる。

エネルギー

磁化

帯磁率

比熱
 |